1. What Is Excel Data Analysis, and Why Should Beginners Learn It?
Excel data analysis is the process of organising, checking, calculating, summarising and interpreting information using spreadsheet tools. The aim is to turn raw data into useful information that supports decisions.
For example, a shop may have hundreds of sales records. By using Excel, the owner can calculate total sales, identify popular products and compare sales across different months.
You do not need to be a mathematics expert to begin. Basic arithmetic, attention to detail and a willingness to practise are enough to get started with beginner-level analysis.
Benefits of learning Excel data analysis
- Organise information efficiently: Excel allows you to arrange data in rows and columns, sort records and filter information according to specific requirements. This makes large lists easier to manage.
- Understand trends and patterns: Charts, summaries and PivotTables can help you identify changes in sales, expenses, attendance or other measurements.
- Reduce repetitive calculations: Functions such as SUM, AVERAGE and COUNTIF calculate results automatically. When used correctly, formulas can reduce manual work and help maintain consistency.
- Prepare reports: Excel can turn raw information into summary tables, charts and reports that are easier for colleagues, managers or clients to understand.
- Build a foundation for further learning: Excel data analysis introduces concepts such as data cleaning, aggregation, comparison and visualisation. These concepts can also help when learning business intelligence tools or other data analysis software.

Who can join a beginner Excel data analysis course?
A beginner course may be useful for:
- College students preparing for internships or placements
- Freshers looking for entry-level office or reporting roles
- B.Com, BBA and other commerce students
- Arts and science graduates who want practical computer skills
- Office staff who prepare reports
- Small-business owners who manage sales and expenses
- Professionals who want to improve their spreadsheet skills
If you are completely new to Excel, choose a course that teaches spreadsheet basics before moving to advanced analysis. You can also research broader job skill standards via platforms like Naukri Career Insights.
2. Essential Excel Data Analysis Skills You Should Learn
A useful beginner course should teach you how to work with a dataset from start to finish. The following skills provide a practical learning path.
Excel basics and data formatting
Before analysing data, you need to know how to enter, arrange and format it correctly.
Start by learning how to:
- Create and save workbooks
- Enter and edit data in cells
- Format numbers, dates and percentages
- Adjust column widths and row heights
- Sort records alphabetically or numerically
- Filter data to display selected records
- Freeze headings when working with longer tables
Example: Imagine a spreadsheet containing student names, departments, attendance percentages and internal marks. Sorting can arrange students by marks, while filters can display students from a particular department.
Correct formatting also matters. If dates are inconsistent or numbers are stored as text, calculations and comparisons may not work as expected.
Important Excel formulas and functions
Formulas help you calculate results and summarise information.
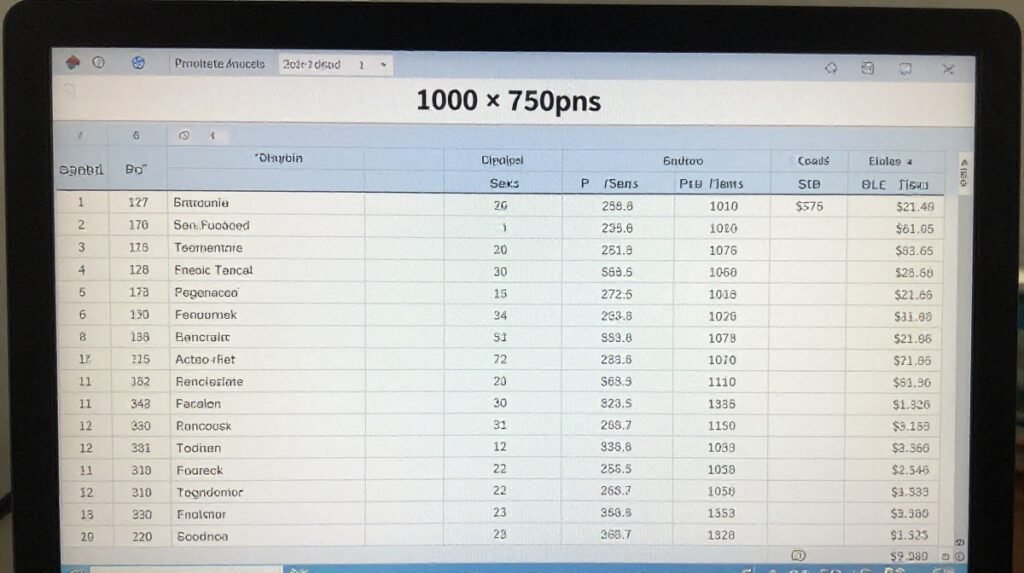
| Function | Purpose | Example |
| SUM | Adds numbers | Total monthly sales |
| AVERAGE | Calculates the mean | Average test score |
| COUNT | Counts numeric cells | Number of recorded transactions |
| COUNTA | Counts non-empty cells | Number of filled customer records |
| IF | Returns a result based on a condition | Marking a payment as Paid or Pending |
| COUNTIF | Counts cells matching a condition | Number of orders marked Delivered |
| SUMIF | Adds values matching a condition | Sales total for one product |
| IFERROR | Handles formula errors with a specified result | Displaying a helpful message when a calculation fails |
For example, if sales amounts are stored in cells C2 through C20, this formula calculates their total: =SUM(C2:C20)
To count how many records in column D are marked “Pending,” you could use: =COUNTIF(D2:D20,”Pending”)
Practise each formula with sample data. Check whether the result makes sense instead of assuming the spreadsheet is always correct. For additional formula breakdowns, check out the W3Schools Excel Tutorial.
Data cleaning and preparation
Data cleaning means identifying and correcting issues that could affect analysis. This is an important skill because even a well-written formula can produce misleading results when the underlying information is inaccurate.
Learn how to:
- Identify duplicate records
- Find missing values
- Correct inconsistent spelling
- Remove unnecessary spaces
- Standardise date formats
- Check numbers stored as text
- Separate information into different columns when needed
For example, a sales spreadsheet might contain the same product under the names “Blue Pen,” “blue pen” and “Blue pen ”. These entries may refer to the same item, but inconsistent text can affect summaries.
Clean the data before calculating totals or creating charts. Keep an unchanged copy of the original dataset so you can check your corrections if necessary.
PivotTables and data summarisation
PivotTables help you summarise a dataset without writing a separate formula for every group.
You can use them to answer questions such as:
- Which product generated the highest total sales?
- How much did each department spend?
- How many orders were placed each month?
- Which category had the most transactions?
Suppose a spreadsheet has 500 sales records. A PivotTable can group the records by product and calculate the total sales for each product.
A beginner course should ideally include guided exercises on creating PivotTables, changing summary calculations and filtering the results.
Charts and data visualisation
Charts help people understand comparisons and trends quickly.
Common Excel charts include:
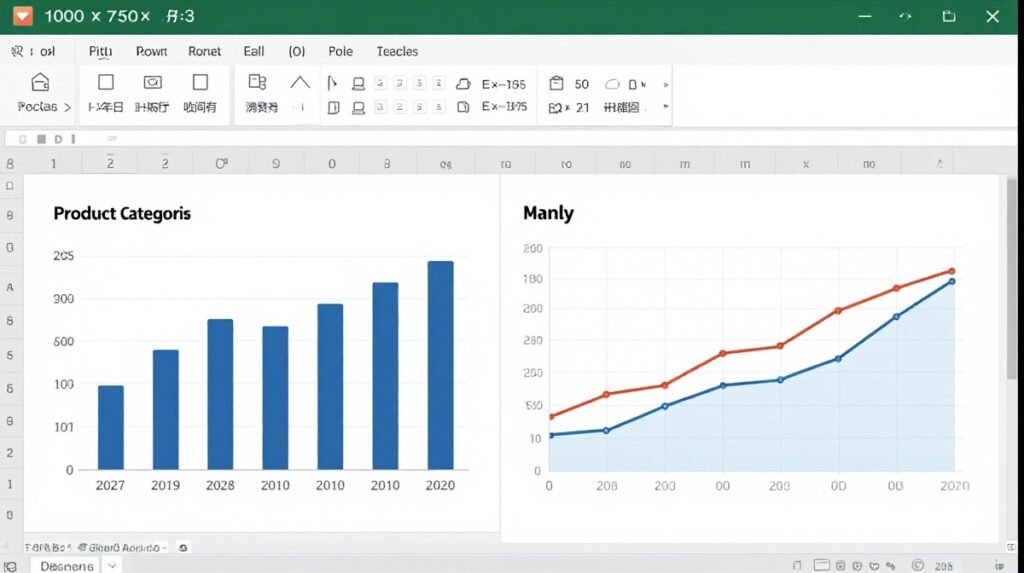
- Column or bar charts: Compare categories, such as sales by product.
- Line charts: Show changes over time, such as monthly revenue.
- Pie charts: Show proportions when there are only a few meaningful categories.
- Scatter charts: Explore the relationship between two numerical variables.
Choose a chart based on the question you want to answer. For example, a line chart is often suitable for showing monthly sales trends, while a bar chart can make product comparisons easier.
Avoid adding too many colours, labels or unnecessary effects. A chart should make the finding clearer, not more complicated.
3. How to Choose an Excel Data Analysis Course in Madurai
When comparing Excel training options in Madurai, look beyond the course name. Two providers may both advertise Excel training but offer different levels of practical instruction.
A suitable course should match your current knowledge, learning goals, available time and budget.
Check the course syllabus
Ask for the complete syllabus before enrolling. For an Excel data analysis course for beginners in Madurai, look for topics such as:
- Spreadsheet basics and formatting
- Essential formulas and functions
- Sorting and filtering
- Data cleaning
- Conditional formatting
- PivotTables
- Charts and visualisation
- Practical assignments using sample datasets
- Report preparation and interpretation
Some courses may also include lookup functions, Power Query or dashboard creation. These can be valuable additions, but make sure you understand the basics first.
Prioritise hands-on practice
Data analysis is a practical skill. Watching a trainer demonstrate a formula is useful, but you also need to write formulas and solve problems independently.
Ask the training provider:
- Will each student get time to practise on a computer?
- Are exercises included after each topic?
- Will I work with complete datasets?
- Can the trainer review my work and explain errors?
- Will I complete a final project?
A useful course should allow you to practise the entire process: prepare data, analyse it, check the results and present a clear summary.
Compare course duration, fees and certificate details
Course length and fees vary between training providers. Confirm the total cost and what is included rather than relying only on an advertised starting price.
| Factor | What to check |
| Course level | Is it designed for complete beginners? |
| Syllabus | Does it cover practical data analysis? |
| Practice | Are computer sessions and assignments included? |
| Trainer support | Can you receive feedback on your work? |
| Duration | Is there sufficient time to practise? |
| Fees | Are registration, assessment and certificate charges included? |
| Certificate | Who issues it, and what are the completion requirements? |
| Learning materials | Are sample files or practice datasets provided? |
If a certificate is important to you, ask whether it is a course-completion certificate from the training centre or a separate external certification. Do not assume that a certificate is an official Microsoft certification unless the provider can verify that claim.
How to compare local training options
You can search for phrases such as:
- Excel data analysis course in Madurai
- Beginner Excel training in Madurai
- Advanced Excel course with practical training
- Excel classes for students and freshers
Check current course details, recent student feedback, trainer experience and the provider’s official information. Contact the centre directly to confirm fees, class timings, syllabus and certificate conditions. To research local reviews and provider directories, you can consult platforms like Justdial Madurai.
This guide does not verify or rank any particular training centre in Madurai. Compare actual course details before deciding where to enrol.
4. Practical Excel Data Analysis Projects for Beginners
Projects help you turn lessons into skills you can demonstrate. Start with simple datasets, then gradually introduce more functions and visualisations.
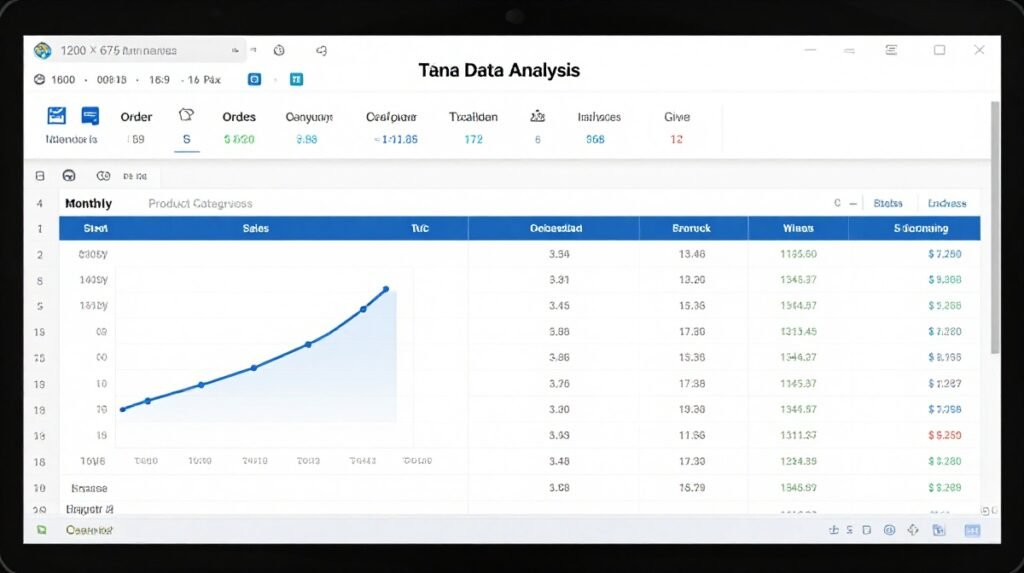
Project 1: Monthly sales analysis
Create a dataset with these columns:
- Order date
- Product name
- Quantity sold
- Unit price
- Total sales
Calculate total sales for each order by multiplying quantity by unit price. Use SUM to calculate total revenue and sort the products by sales amount.
Then create a chart showing sales by product or month.
What you learn: Basic formulas, sorting, summarisation and chart creation.
Project 2: Expense analysis
Build a sample expense sheet with columns for date, expense category, description and amount.
Use SUMIF to calculate spending by category. For example, you could compare transport, food, stationery and electricity expenses.
Create a chart to show how spending is distributed across categories. Before interpreting the result, check that all transactions have been included and assigned to the correct category.
What you learn: Conditional totals, data categorisation and financial reporting.
Project 3: Student performance analysis
Create a sample dataset with student IDs, subjects, marks and attendance percentages.
Use AVERAGE to calculate average marks and IF to classify results according to a clearly defined rule. Sort the marks and create a chart comparing subject averages.
If the dataset contains real student information, do not publish it in a public portfolio without appropriate permission. Use fictional data for practice and demonstrations.
What you learn: Logical functions, comparisons and responsible data handling.
Project 4: Customer order dashboard
Prepare a dataset containing order dates, customer IDs, product categories, quantities and order values.
Create a PivotTable to summarise sales by month or product category. Add a chart to highlight the main findings.
Your dashboard might include:
- Total sales
- Number of orders
- Sales by category
- Monthly sales trend
Keep the dashboard simple and label every chart clearly. A dashboard is useful only when the figures are accurate and the reader can understand what they represent.
Build a small portfolio
Save your projects with clear filenames, such as:
- Monthly_Sales_Analysis.xlsx
- Expense_Analysis.xlsx
- Student_Performance_Analysis.xlsx
- Customer_Order_Dashboard.xlsx
For each project, write a short explanation of the question you investigated, the functions or tools you used, and the finding you discovered.
Do not include confidential customer, employer or student data. Use sample information, and check that the workbook opens correctly before sharing it.
5. Career Benefits of Excel Data Analysis Skills
Excel data analysis can support several entry-level roles, especially those involving reporting, records, operations or administration. However, learning Excel alone does not guarantee employment. Employers may also require a relevant degree, communication skills, domain knowledge or experience with other software. To check general workforce expectations, review insights on the LinkedIn Learning Blog.
Roles where Excel analysis may be useful
- Data entry operator: Maintains accurate records, checks entries and organises information.
- Office or administrative assistant: Prepares lists, schedules, routine reports and summaries.
- Accounts assistant trainee: Helps maintain expense records, payment information and financial spreadsheets. Accounting knowledge and familiarity with relevant accounting software may also be required.
- Sales coordinator: Updates sales data, tracks orders and prepares summaries for the sales team.
- Operations assistant: Organises operational records and helps monitor routine performance measures.
- Junior reporting assistant: Prepares spreadsheet reports and summarises information for review by colleagues or managers.
The Excel level required differs by employer. Some jobs focus on accurate data entry and simple formulas, while reporting roles may expect PivotTables, lookup functions and dashboard skills.
How to include Excel data analysis on your resume
List the functions and tools you can use confidently. For example:
Technical Skills
- Microsoft Excel: data formatting, sorting and filtering
- Formulas: SUM, AVERAGE, IF and COUNTIF
- Data analysis: PivotTables and charts
- Projects: monthly sales analysis and expense report
Include PivotTables or other advanced tools only if you have practised them. If possible, prepare a small portfolio that demonstrates your ability to use those features.
During an interview, you may be asked to clean a dataset, calculate a total, summarise records or explain a chart. Practise completing these tasks without relying entirely on step-by-step instructions.
6. A Four-Week Excel Data Analysis Learning Plan
You can begin learning Excel data analysis in stages. The following four-week plan is a sample schedule, not a guarantee that you will master every topic within a month.
| Week | Main focus | Practice activity |
| Week 1 | Excel basics, formatting and data entry | Create and format a sales dataset |
| Week 2 | Formulas and functions | Calculate totals, averages and category-based results |
| Week 3 | Data cleaning, PivotTables and charts | Summarise and visualise a dataset |
| Week 4 | Final project and revision | Complete a small analysis report and explain the findings |
Tips to make steady progress
- Practise regularly, even for 20 to 30 minutes a day.
- Use sample datasets rather than copying formulas without context.
- Check formula results against a manual calculation when possible.
- Learn one feature at a time before combining several tools.
- Keep a note of formula errors and how you corrected them.
- Explain your chart or report in simple sentences.
- Repeat exercises until you can complete them with less guidance.
Common mistakes beginners should avoid
- Analysing unclean data: Check for missing values, duplicates and inconsistent formats before drawing conclusions.
- Using the wrong formula or range: Verify cell references and test the output on a small sample.
- Choosing an unsuitable chart: Select the chart that best answers your question instead of choosing one just because it looks attractive.
- Ignoring context: A high sales total does not automatically mean a product is profitable. Consider what the data actually measures and what information is missing.
- Making claims from limited data: A small sample may not represent the full picture. State the limits of your analysis.
- Focusing only on certificates: A certificate may document course completion, but practical skills and the ability to explain your findings are equally important.
Frequently Asked Questions
1. Which is the best Excel course for beginners in Madurai?
Look for a course that begins with spreadsheet fundamentals, covers formulas and data cleaning, introduces PivotTables and charts, and provides substantial hands-on practice. Compare the syllabus, total fees, trainer support and certificate details before enrolling.
2. Can I learn Excel data analysis without prior experience?
Yes. Start with basic spreadsheet operations and simple functions. Once you are comfortable entering, formatting and checking data, move on to summaries, PivotTables and charts.
3. How long does it take to learn Excel data analysis?
It depends on your starting level, practice time and course syllabus. You may learn basic functions in a few weeks, but developing confidence with larger datasets, PivotTables and reporting generally requires continued practice.
4. Is Excel data analysis useful for freshers?
Yes. It can be useful for entry-level roles involving administration, sales reporting, records, operations and basic analysis. The specific requirements depend on the job, and additional skills may be necessary.
5. Should I learn Excel before Power BI or other data analysis tools?
For many beginners, learning Excel first is a practical approach because it introduces formulas, data organisation, summarisation and charts. After you understand these fundamentals, you can consider tools such as Power BI based on your career goals.
Conclusion
An Excel data analysis course for beginners in Madurai can help you develop practical skills for working with spreadsheets and understanding business information. Start with formatting, formulas and data cleaning, then practise PivotTables, charts and small projects.
When comparing courses, look for a clear syllabus, hands-on exercises, useful trainer feedback and transparent certificate details. Choose a course that matches your current level rather than one that promises to teach every advanced feature immediately.
Your next step: Find two or three Excel training options in Madurai and ask for their syllabus, total fees, duration and practical project details. Choose one that provides enough time for independent practice. Then build two or three small projects that show not just that you can use Excel, but that you can turn data into clear, useful findings.