Microsoft Excel is one of the most useful tools for managing business information, organizing records, preparing reports, and analyzing data. From small businesses to large companies, professionals use Excel to track expenses, monitor sales, maintain customer details, and make informed decisions.
If you are looking for the best Excel course for business and data management in Koodal Nagar, choosing the right training program can help you develop practical skills that are useful in many office-based jobs. However, not every Excel course teaches the same things. Some focus only on basic spreadsheets, while others cover advanced formulas, PivotTables, dashboards, and business reporting.
The right course should match your current knowledge, career goals, learning preferences, and budget. You can also explore essential data analysis skills to see how spreadsheet tools fit into broader analytical paths.
In this guide, you will learn what an Excel course should include, which skills are important for business and data management, how to compare training options in Madurai, and what to consider before enrolling.
Why Is Excel Important for Business and Data Management?
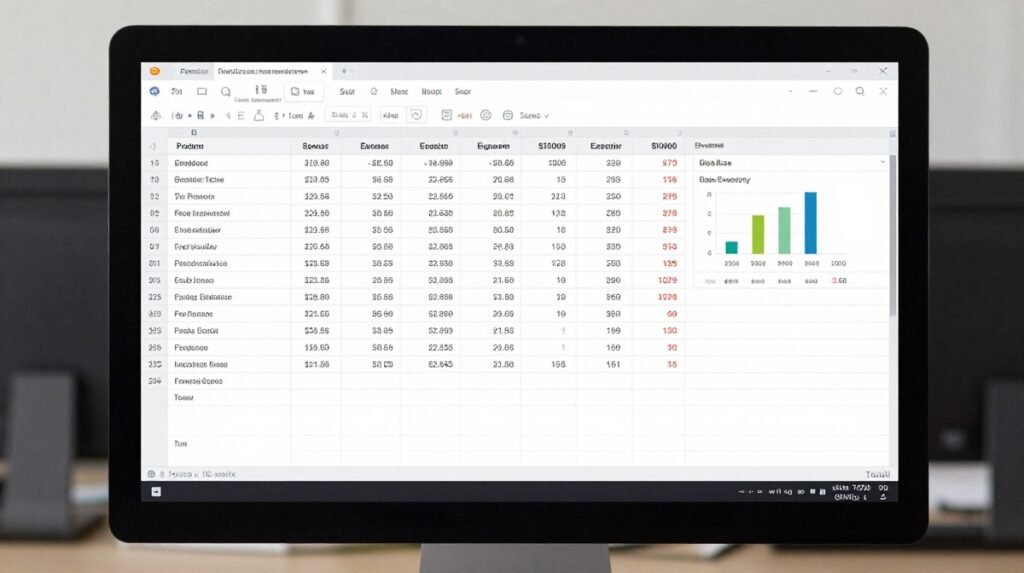
Microsoft Excel is a spreadsheet application that helps users store, organize, calculate, and analyze information. It is widely used because it combines simple data entry with powerful calculation and reporting features.
For businesses, Excel can turn a collection of numbers into useful information. For example, a shop owner can record daily sales, compare monthly revenue, calculate expenses, and identify popular products using a single workbook.
Learning Excel is particularly helpful for students, fresh graduates, office administrators, accountants, and people who want to improve their computer skills.
1. Organizing Business Information
Businesses handle different types of information, including customer records, product details, employee information, invoices, and payments.
Excel allows users to arrange these details in rows and columns, sort records, filter information, and find specific entries quickly.
Practical example: A retail shop can maintain a spreadsheet containing product names, purchase prices, selling prices, available stock, and sales quantities.
2. Performing Calculations Automatically
Excel formulas reduce the need for repeated manual calculations. Functions such as SUM, AVERAGE, IF, COUNTIF, and SUMIF help users calculate totals, evaluate conditions, and summarize business data.
For instance, an employee can use a formula to calculate monthly expenses or identify whether a sales target has been achieved.
3. Preparing Reports and Charts
Managers often need reports that communicate information clearly. Excel can convert raw data into tables, charts, and summary reports.
These features are useful for comparing monthly sales, monitoring expenditure, tracking employee attendance, and presenting business performance.
4. Supporting Better Business Decisions
Accurate data helps business owners understand what is happening in their operations. Excel makes it easier to identify trends, compare results, and recognize areas that need attention.
Although Excel cannot replace sound business judgment, it can provide information that supports more informed decisions.
What Should the Best Excel Course for Business and Data Management Include?
When comparing training options in Madurai, look beyond the course title. A useful program should teach practical skills that you can apply to real business situations.
Ideally, the course should progress from basic spreadsheet operations to data analysis and reporting.
1. Excel Basics and Spreadsheet Management
Beginners should first understand the Excel interface and learn how to create and manage worksheets.
Important topics include:
- Creating, saving, and editing workbooks.
- Entering and formatting data.
- Adjusting rows, columns, and cell sizes.
- Using number, date, and currency formats.
- Sorting and filtering records.
- Creating and formatting tables.
- Applying conditional formatting.
- Printing worksheets and setting page layouts.
These fundamentals are important because accurate data entry and clear formatting make spreadsheets easier to use and maintain.
Practice task: Create a monthly expense sheet with columns for date, expense category, description, and amount. Format the amounts as currency and calculate the total expenditure.
2. Excel Formulas and Functions
Formulas are among the most important skills for business and data management.
A good Excel course should explain how formulas work, when to use different functions, and how to identify common formula errors. You can check official Microsoft Excel documentation to explore additional function guidelines.
| Formula or function | Business application |
| SUM | Calculate total sales or expenses |
| AVERAGE | Find average monthly sales |
| IF | Check whether a target has been achieved |
| COUNTIF | Count records matching a condition |
| SUMIF | Calculate sales for a particular category |
| XLOOKUP | Retrieve matching information from another table |
| IFERROR | Handle specified formula errors |
| SUBTOTAL | Calculate summaries for filtered lists |
For example, suppose a salesperson has a monthly target of ₹50,000. The following formula checks whether the sales target has been achieved:
=IF(B2>=50000,”Target Achieved”,”Target Not Achieved”)
If cell B2 contains the salesperson’s total sales, Excel displays the appropriate result.
Students should also understand relative and absolute cell references, as these are essential when copying formulas across a worksheet.
3. Data Cleaning and Management
Business data is not always perfectly organized. It may contain duplicate records, inconsistent names, missing values, or incorrect date formats.
A practical Excel course should teach learners how to identify and correct these problems before analyzing the information.
Useful tools include:
- Remove Duplicates.
- Find and Replace.
- Text to Columns.
- Data Validation.
- Flash Fill.
- Sorting and filtering.
- Excel Tables.
Practical example: Imagine a customer database contains the same customer several times, with telephone numbers entered in different formats. Data-cleaning techniques can help standardize the information and reduce errors.
Remember that removing duplicates or replacing values should be done carefully. Always check the original data and retain a backup before making significant changes.
4. PivotTables and Data Analysis
PivotTables help users summarize large datasets without manually calculating every total.
They can group information by category, compare results, and show patterns in business data.
For example, a company with thousands of sales transactions can use a PivotTable to find:
- Total sales by product.
- Monthly revenue.
- Sales by region.
- Performance by salesperson.
- Quantity sold for each category.
PivotTables are especially valuable for people interested in reporting, administration, accounting support, and entry-level data analysis.
A course should provide practice datasets so learners can build PivotTables themselves rather than simply watch demonstrations.
5. Charts, Dashboards, and Business Reporting
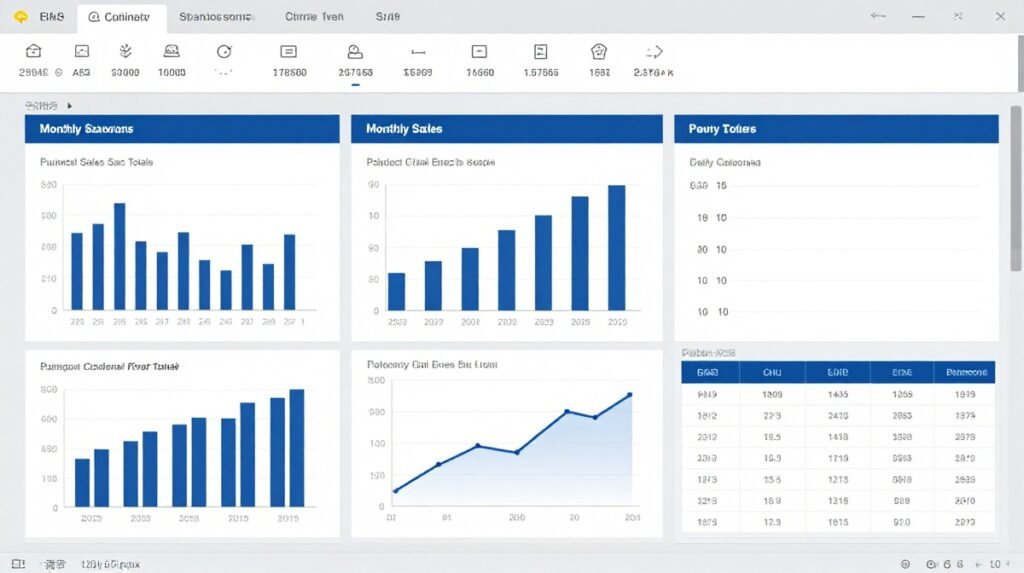
A dashboard presents important information in a clear, visual format. It may contain sales totals, performance indicators, charts, and category-wise comparisons.
A useful Excel training program should cover chart selection, conditional formatting, summary tables, and dashboard design.
For example, a small business owner could create a monthly sales dashboard displaying total revenue, top-selling products, expenses, and sales trends.
When creating a dashboard, prioritize clarity over decoration. Use appropriate chart types, clear labels, consistent number formats, and only the information needed to answer the business question.
6. Advanced Excel and Automation
After learning the fundamentals, students may benefit from advanced features that improve efficiency.
Depending on the course level, these may include:
- Advanced logical and lookup formulas.
- Advanced PivotTable features.
- Power Query for importing and transforming data.
- Data validation rules.
- What-If Analysis.
- Macros and introductory VBA.
- Integration with Power BI or other reporting tools.
Not every beginner needs all these topics immediately. Choose an advanced course if you already understand the basics or need these skills for a specific role.
How to Choose the Best Excel Course Training in Madurai
If you are searching for Excel training in Koodal Nagar or nearby parts of Madurai, compare courses based on what you will actually learn and practise.
A nearby institute may be convenient, but location alone does not determine the quality of training.
1. Check the Course Syllabus
Ask for a detailed syllabus before enrolling. Confirm whether the course covers the skills you need, particularly formulas, data cleaning, PivotTables, charts, and business reporting.
If your goal is office administration, focus on spreadsheet management and reporting. If you want to work in data analysis, look for more extensive coverage of advanced functions, Power Query, and data visualization.
2. Look for Practical Training
Excel is a practical skill, so exercises are essential.
Ask whether the course includes assignments involving sales reports, inventory sheets, expense trackers, attendance records, and customer databases.
The best learning experience combines explanation, demonstration, independent practice, and feedback.
3. Evaluate the Trainer’s Experience
A trainer should be able to explain not only how a formula works but also why it is useful.
Ask about the trainer’s experience with Excel, business reporting, data management, and real-world spreadsheet problems.
A short demonstration class can help you understand the teaching style before committing to the full course.
4. Compare Fees and Course Duration
Course fees vary according to the syllabus, duration, training format, and level of support.
Rather than choosing solely on price, compare the total learning value.
Consider the following:
- Total number of training hours.
- Classroom or online learning options.
- Availability of practice files.
- Access to recorded lessons, if offered.
- Doubt-clearing support.
- Assessment and project opportunities.
- Certificate details, if included.
Ask for the complete fee structure and check whether additional charges apply to study materials or examinations.
5. Check Reviews and Visit the Institute
Before selecting an institute in Koodal Nagar, Madurai, check recent reviews and confirm that the address, course availability, and schedule are current.
If possible, visit the training centre and ask to see the classroom facilities and course materials.
Do not assume that every computer training institute offers a dedicated business-focused Excel program. Contact the institute directly to verify its current syllabus and batch availability.
Important: This guide provides criteria for comparing courses, not a verified ranking of individual institutes. Confirm current course details directly with providers before enrolling.
Who Should Learn Excel for Business and Data Management?
Excel is useful for people with different educational backgrounds and career goals. You do not need to be an accountant or a computer science graduate to begin learning it.
College Students and Fresh Graduates
Students can use Excel to organize academic information, prepare project budgets, manage survey responses, and build basic data-analysis skills.
For fresh graduates, practical Excel knowledge can be useful when applying for entry-level administrative and reporting roles.
Office Administrators
Administrative employees often maintain attendance sheets, customer records, schedules, expense reports, and other documents.
Excel can help them organize these records and reduce repetitive calculations.
Accounting and Finance Learners
Excel supports calculations, transaction summaries, expense tracking, budgeting, and financial reporting.
However, professional accounting work may also require knowledge of accounting principles and specialized software.
Small Business Owners
Business owners can use Excel to track inventory, calculate profit margins, monitor expenses, compare monthly sales, and prepare simple business reports.
A well-maintained spreadsheet can be a practical starting point before adopting more specialized business software.
Aspiring Data Analysts
Excel provides a foundation for working with structured data. Learners can later expand their skills into SQL, Power BI, Python, or other data-analysis tools.
For aspiring analysts, it is helpful to learn how to clean data, summarize it accurately, explain findings, and communicate results clearly.
What Career Opportunities Can Excel Skills Support?
Excel is used across many industries, including retail, education, healthcare administration, finance, logistics, and professional services.
Depending on your broader qualifications and experience, Excel skills may support applications for roles such as:
- Data entry operator.
- Office assistant.
- Administrative executive.
- Sales coordinator.
- Inventory assistant.
- Accounts assistant.
- MIS executive.
- Junior reporting analyst.
Excel alone does not guarantee a job. Employers may also expect communication skills, attention to detail, relevant qualifications, industry knowledge, or familiarity with other software.
For example, an MIS executive position may require advanced Excel, regular report preparation, and the ability to verify data accuracy. A junior data analyst role may require SQL, Power BI, or Python in addition to Excel.
Build a Small Excel Portfolio
One way to demonstrate your skills is to create a few sample projects using fictional or publicly available data.
Consider developing these three projects:
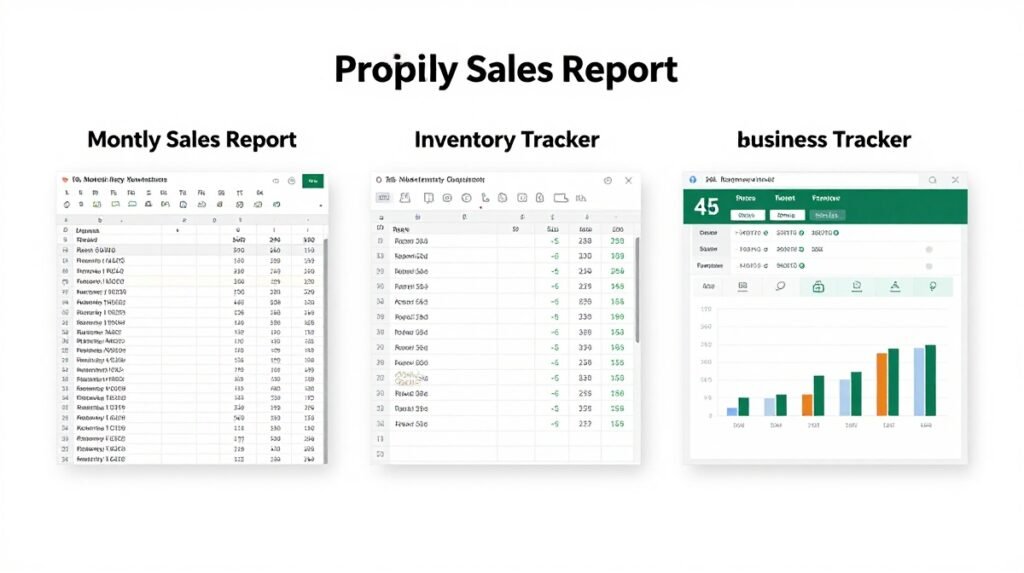
- Monthly sales report: Calculate revenue, compare products, and summarize monthly performance.
- Inventory tracker: Record stock levels, identify low-stock items, and calculate inventory value.
- Business dashboard: Present key performance indicators using charts, formulas, and PivotTables.
For each project, explain the purpose, the tools used, and the main findings. Do not include confidential customer or employer information.
These projects can help you demonstrate practical ability during interviews, even when you are at the beginning of your career.
A Simple Learning Roadmap for Beginners
If you are new to Excel, follow a structured learning plan rather than attempting advanced features immediately.
| Learning stage | Main topics | Practice project |
| Stage 1 | Interface, data entry, formatting | Personal expense sheet |
| Stage 2 | Basic formulas and functions | Monthly budget calculator |
| Stage 3 | Sorting, filtering, and data cleaning | Customer database |
| Stage 4 | Lookup functions and PivotTables | Product sales summary |
| Stage 5 | Charts and dashboards | Monthly business dashboard |
| Stage 6 | Advanced tools, based on your goal | Inventory or performance report |
The time needed depends on your starting level, practice schedule, and course structure. Regular hands-on practice is more useful than memorizing formulas without understanding how they work.
Try to complete each stage independently before moving to the next one. If a formula produces an unexpected result, check the cell references, data types, and formula syntax instead of immediately replacing it with another formula.

Common Mistakes to Avoid When Learning Excel
Even students who understand basic formulas can make errors when managing business data.
Watch out for these common problems:
- Learning formulas without practical application: Memorizing functions is not enough. Practise using them with realistic datasets.
- Ignoring data accuracy: Incorrect dates, inconsistent entries, and duplicate records can affect reports. Check your source data before calculating totals.
- Overusing complicated formulas: Use the simplest reliable method that solves the problem. Complex formulas can be difficult to maintain when a spreadsheet grows.
- Creating confusing dashboards: Too many colours, charts, and unnecessary numbers can make a report harder to understand. Focus on the information the reader needs.
- Choosing a course based only on a certificate: A certificate may document course completion, but practical ability is what allows you to complete spreadsheet tasks confidently. Review the syllabus and project work before enrolling.
- Skipping independent practice: Watching a trainer perform a task is different from completing it yourself. Rebuild the examples without following step-by-step instructions.
Frequently Asked Questions
1. Which Excel course is best for business and data management?
A course that covers spreadsheet basics, formulas, data cleaning, PivotTables, charts, and business reporting is a good starting point. If you need advanced analysis, look for Power Query, dashboard development, and other relevant advanced topics.
2. How can I find the best Excel course in Koodal Nagar, Madurai?
Search for computer training institutes in Koodal Nagar and nearby Madurai areas. Compare their current syllabuses, practical assignments, trainer experience, fees, duration, and student reviews. Contact each provider to confirm that business-focused Excel training is available.
3. Can I learn Excel without previous computer knowledge?
Yes. Beginners can start with basic computer operations and spreadsheet formatting before learning formulas and data analysis. Regular practice will help build confidence.
4. Is Excel useful for getting a job?
Yes. Excel is a useful skill for many administrative, sales-support, accounting-support, reporting, and data-related positions. However, job requirements vary, and Excel may need to be combined with other qualifications or software skills.
5. How long does it take to learn Excel?
The duration depends on your goals and practice time. Basic spreadsheet operations may be learned relatively quickly, while advanced formulas, PivotTables, data cleaning, and dashboards require additional practice. Ask the training provider how many hours are devoted to each topic.
Conclusion
Choosing the best Excel course for business and data management in Koodal Nagar starts with understanding your goals and comparing the practical value of available programs.
Look for training that covers formulas, data organization, data cleaning, PivotTables, charts, and business reports. If you plan to pursue data analysis, consider progressing to advanced Excel features and complementary tools such as Power BI learning resources or SQL tutorials.
Before enrolling, review the syllabus, ask about practical assignments, compare fees, and verify the institute’s current course details. Once you begin learning, practise with small projects that demonstrate how Excel solves real business problems.
Ready to improve your Excel skills? Start by identifying the type of work you want to do, shortlist suitable training providers in Madurai, and choose a course that gives you enough hands-on practice to apply what you learn confidently.
Internal Linking Opportunities
Add relevant internal links to related articles on your website using these anchor texts:
- Excel formulas every beginner should know
- How to create a monthly expense tracker in Excel
- Excel PivotTables explained for beginners
- How to create a business dashboard in Excel
- Best computer courses for college students
- Excel vs. Power BI: Which should you learn first?
- Essential data analysis skills for beginners
Editorial note: The course-selection advice in this article is general educational guidance. Specific institute rankings, current fees, course availability, and local student experiences should be independently verified before making claims about individual providers.